
Eric Xi — Founder of Starview Media • Business Analyst • Visualization Designer • Project Manager
Transforming Data into Insight, Strategy, and Visual Storytelling
About Me
I am a Business Analytics graduate student with prior experience in Canadian banking, combining a strong understanding of business operations with growing capabilities in programming, data analysis, and applied AI.
I am particularly interested in roles that sit at the intersection of business decision-making, risk awareness, and data-driven insights.
Through both professional experience and academic projects, I focus on translating data into practical recommendations that support business performance, customer outcomes, and operational effectiveness.


Story Telling Portfolio - Sept 2025 to Dec 2025
A snapshot of my past design projects.


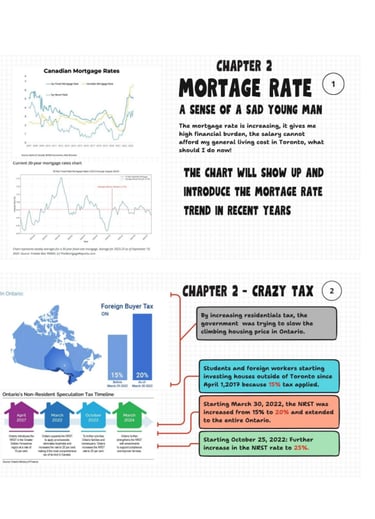
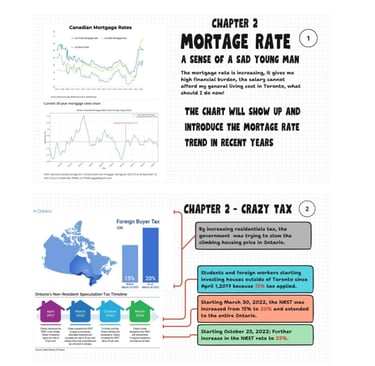
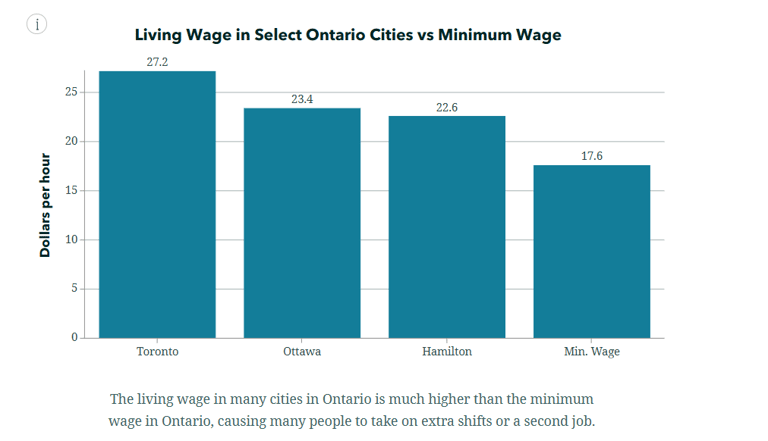
An integrated storyboard visualizing how rising rents, stagnant wages, and demographic shifts reshape the economic reality for newcomers and young residents.
Highlights:
Multi-chart narrative construction
Labour and cost-of-living analysis
Visual storytelling with socio-economic framing
Techniques: Python analysis, structured layout design, insight synthesis.
Project 2 — Interactive Reconstruction of John Snow’s 1854 Cholera Map
Transforming a historical map into a modern analytical platform
Project 1 — Housing Affordability Storyboard
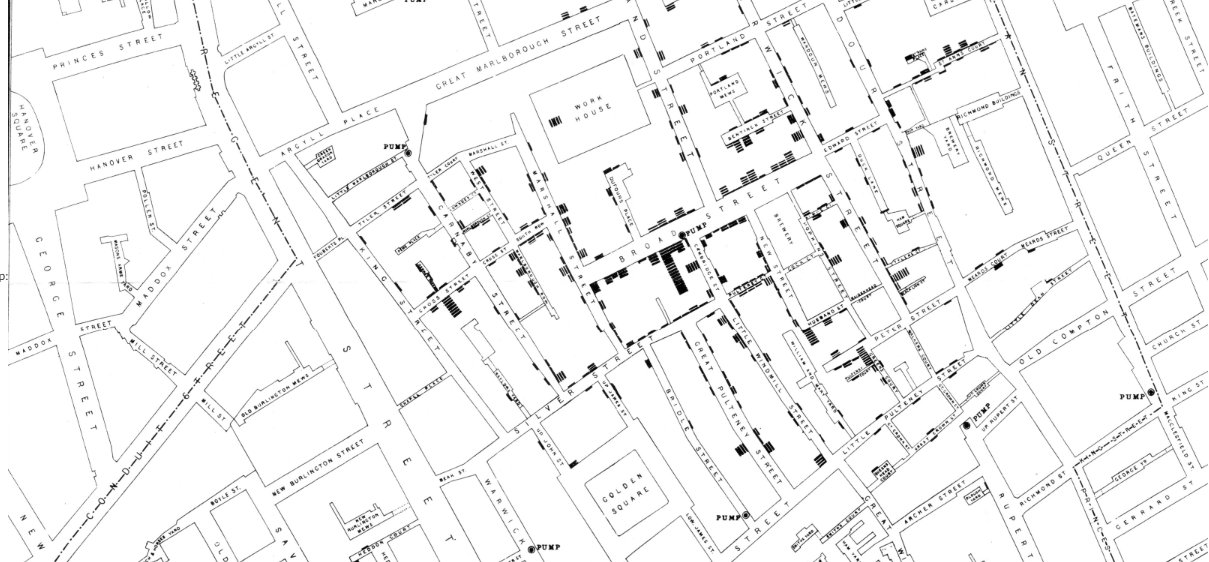
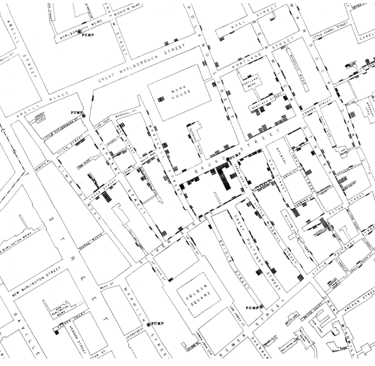
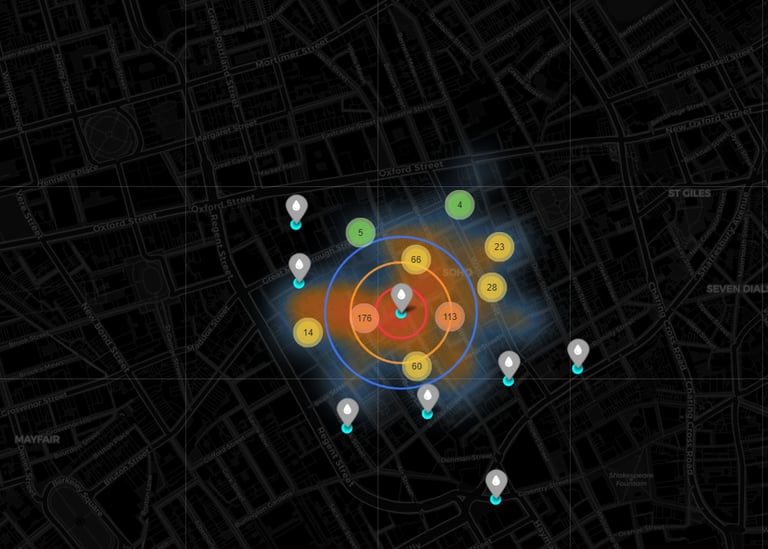
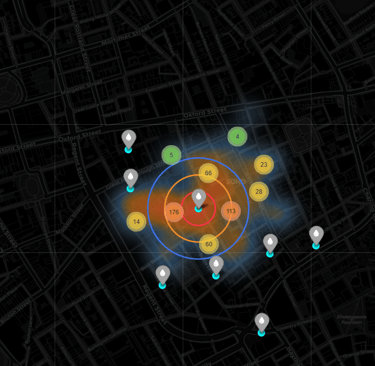
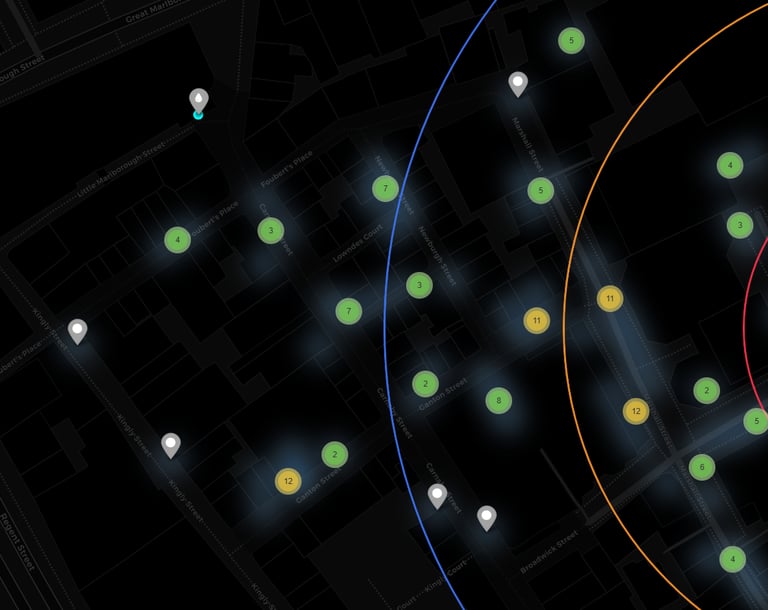

Rebuilt the iconic cholera map using Python + Folium, introducing zooming, density heatmaps, spatial clustering, and interactive layers.
Highlights:
Geospatial engineering
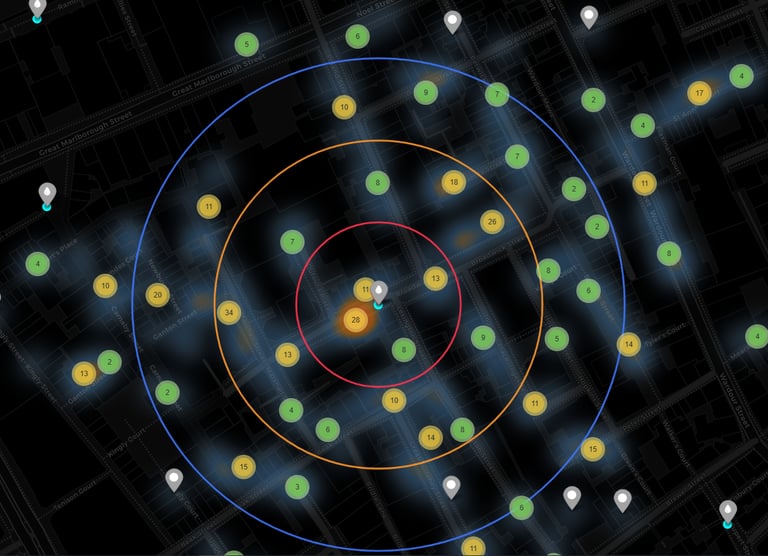
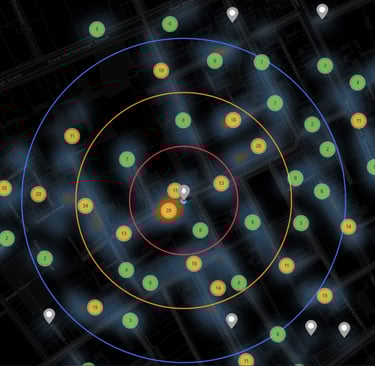
Layered visualization (heatmap, clusters, pump radius)
Historical-to-modern data reinterpretation
Impact: Demonstrates capability in advanced visualization engineering and user-centered analytical tools.
Project 3 — Canadian Federal Budget Infographic
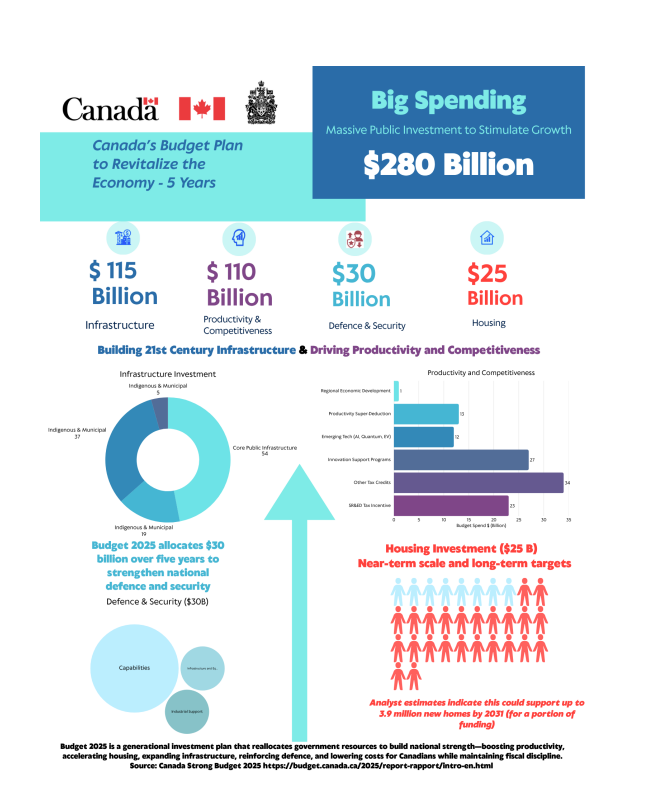
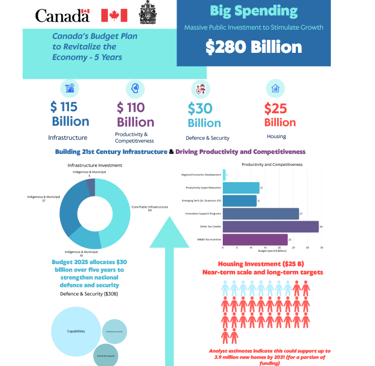
Designing a professional-grade infographic for public communication
A narrative-driven examination of economic pressures in Ontario
Rebuilt the iconic cholera map using Python + Folium, introducing zooming, density heatmaps, spatial clustering, and interactive layers.
Highlights:
Geospatial engineering
Layered visualization (heatmap, clusters, pump radius)
Historical-to-modern data reinterpretation
Impact: Demonstrates capability in advanced visualization engineering and user-centered analytical tools.
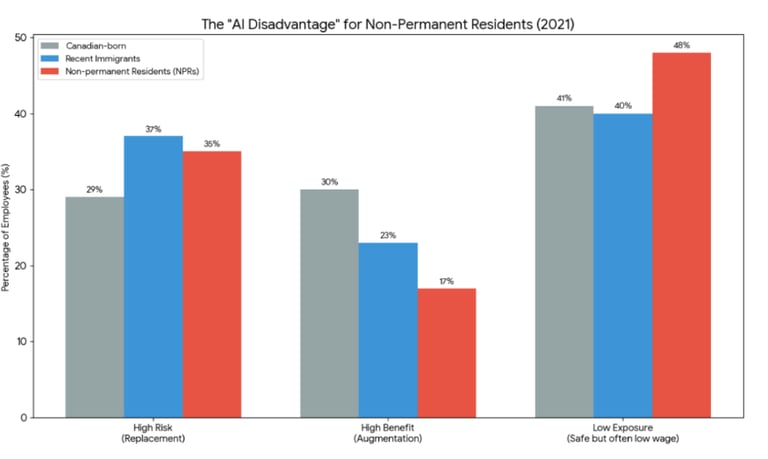
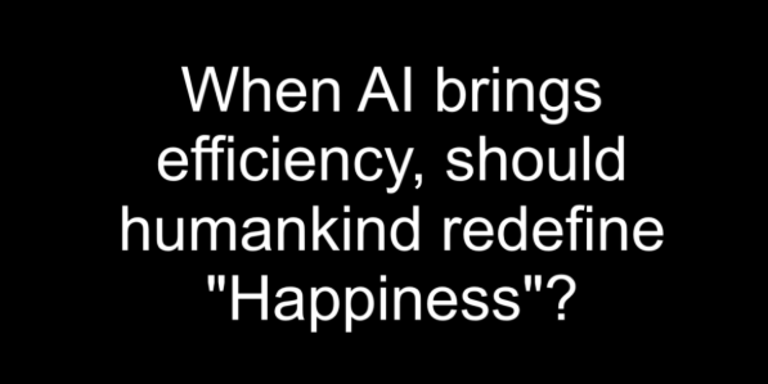
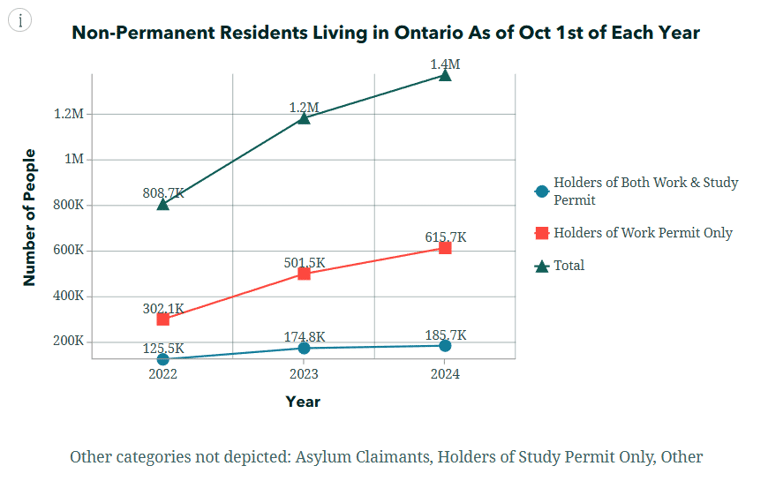
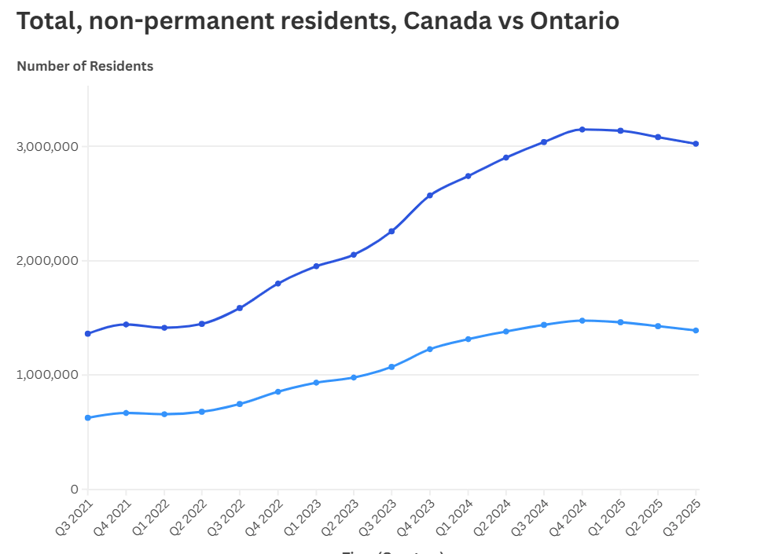
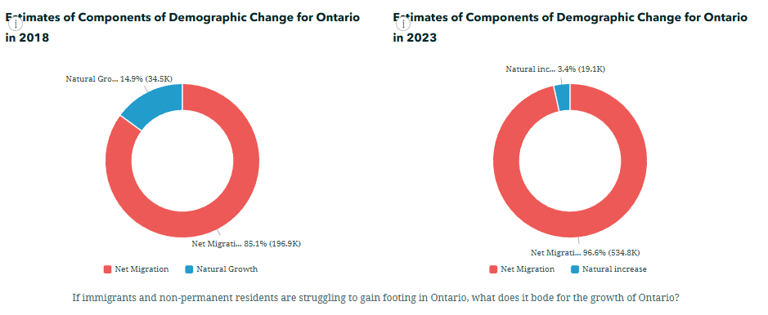
Project 4 — The Fleeting Dream: A Data-Driven Socio-economic Narrative
A long-form analytical narrative combining images, line charts, bar charts, and lived-experience context to explain the evolving “Canadian Dream.”
Highlights:
Multi-source data integration
Trend analysis and contextual interpretation
Storytelling applied to policy and economic insight
Strength: Demonstrates ability to turn data into meaning and meaning into strategic communication.
Exploring how demographic trends and labour pressures reshape opportunity
Python (Pandas, NumPy, Statsmodels, geospatial libraries)
Visualization (Folium, heatmaps, layered mapping, infographic design)
Analytical frameworks (exploratory analysis, descriptive modeling, comparative studies)
Communication tools (structured narratives, visual reports, presentations)
Professional Orientation


Technical Toolkit
I approach every analytical task with:
Attention to detail
Structured methodology
Design discipline
Clear communication standards
A commitment to producing work at publishable quality
Whether supporting business strategy, marketing communication, public policy, or operational insight, I deliver solutions that are thorough, interpretable, and visually precise.
“Where analytics meets design — I turn data into stories that drive action.”
—Eric Xi
Connect
📞 Call or text us on WhatsApp for quick consultation
📧 Email us your advertising ideas
🆓 Book a Free On-Site Demo
CONTACT Support
+1-416-820-8169
© 2025. STARVIEW MEDIA All rights reserved.
Empowering local businesses with dynamic advertising.